Charting Referee Card Distributions in Domestic Leagues for Informed Strategies
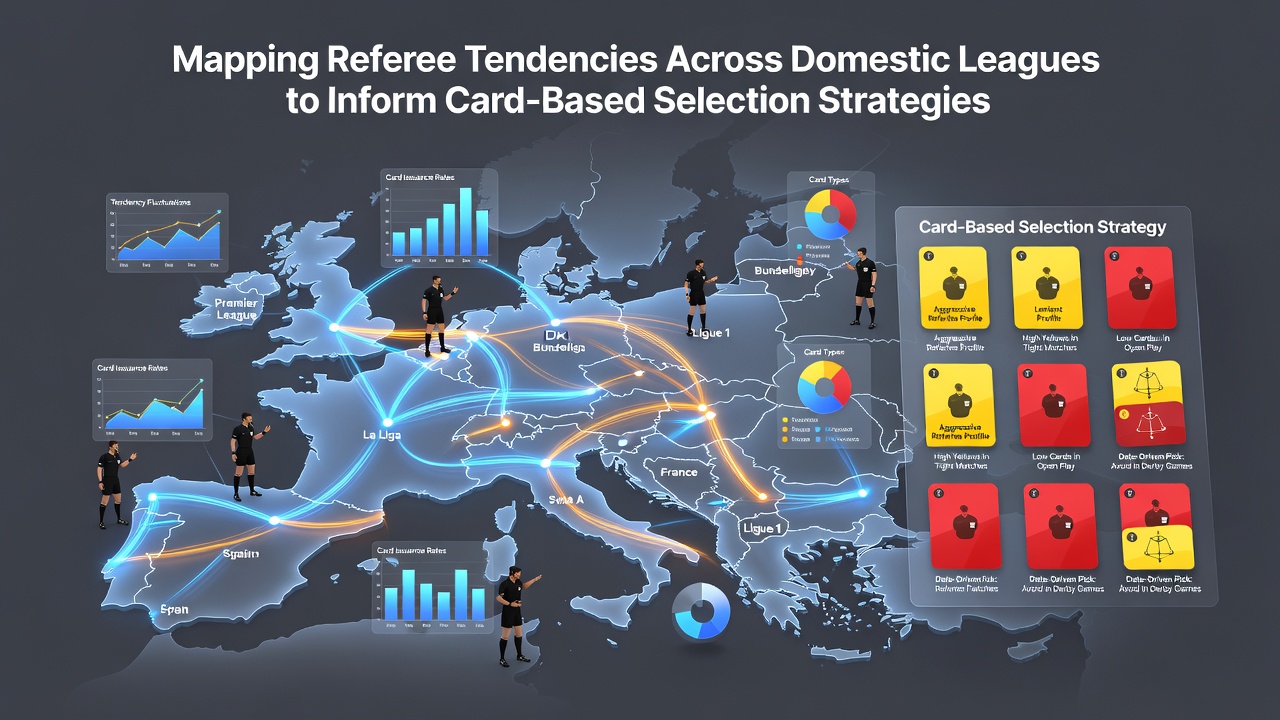
Referee tendencies in domestic football leagues create distinct patterns that observers track through card issuance data, and these records help shape selection methods for card-related strategies across competitions. Statistics compiled from the 2025/2026 campaigns reveal wide differences in how officials manage discipline, with some leagues averaging 5.2 yellow cards per match while others sit closer to 3.8, and such contrasts emerge clearly when broken down by individual referee rather than league-wide averages alone.
European League Patterns and Individual Referee Records
English, Spanish, Italian, and German domestic leagues each maintain public databases of referee performance metrics, and researchers cross-reference these figures with match context such as home versus away fixtures or high-stakes derbies. One dataset covering August 2025 through July 2026 shows that certain officials in the Bundesliga issue red cards at a rate 18 percent above the league mean, whereas Serie A referees maintain lower averages for second yellows in the final 15 minutes of games. Observers note that these variations hold steady across multiple seasons, which allows analysts to build profiles that factor in travel schedules, fixture congestion, and even weather conditions reported on match days.
La Liga records indicate that referees from specific regions issue cards more frequently when matches involve teams from rival cities, and this tendency appears consistent in both midweek and weekend fixtures. Data from the same period highlights how French Ligue 1 officials differ again, posting higher foul counts that convert into cards during the opening 30 minutes compared with their counterparts in the Eredivisie.
Additional Domestic Competitions Beyond Europe
North and South American leagues contribute further layers to these maps, with Major League Soccer publishing detailed referee reports that include card tallies broken down by crew. Figures reveal that certain MLS officials average 4.1 yellow cards per game in Eastern Conference matches, while Western Conference games see slightly elevated rates tied to physical styles of play. Argentine Primera División statistics, gathered through league-mandated tracking systems, demonstrate even sharper spikes during clásico encounters, where card counts rise by nearly 30 percent over regular-season norms.
Australian A-League data adds another dimension, since its referees operate under different disciplinary guidelines that emphasize early intervention. Records from the 2025/2026 season show lower overall card totals yet higher instances of straight reds for denying goal-scoring opportunities, and these patterns remain stable enough for long-term modeling. Observers combine such regional datasets with European figures to create broader selection frameworks that account for travel fatigue and squad rotation effects.
Building Selection Frameworks from Aggregated Data
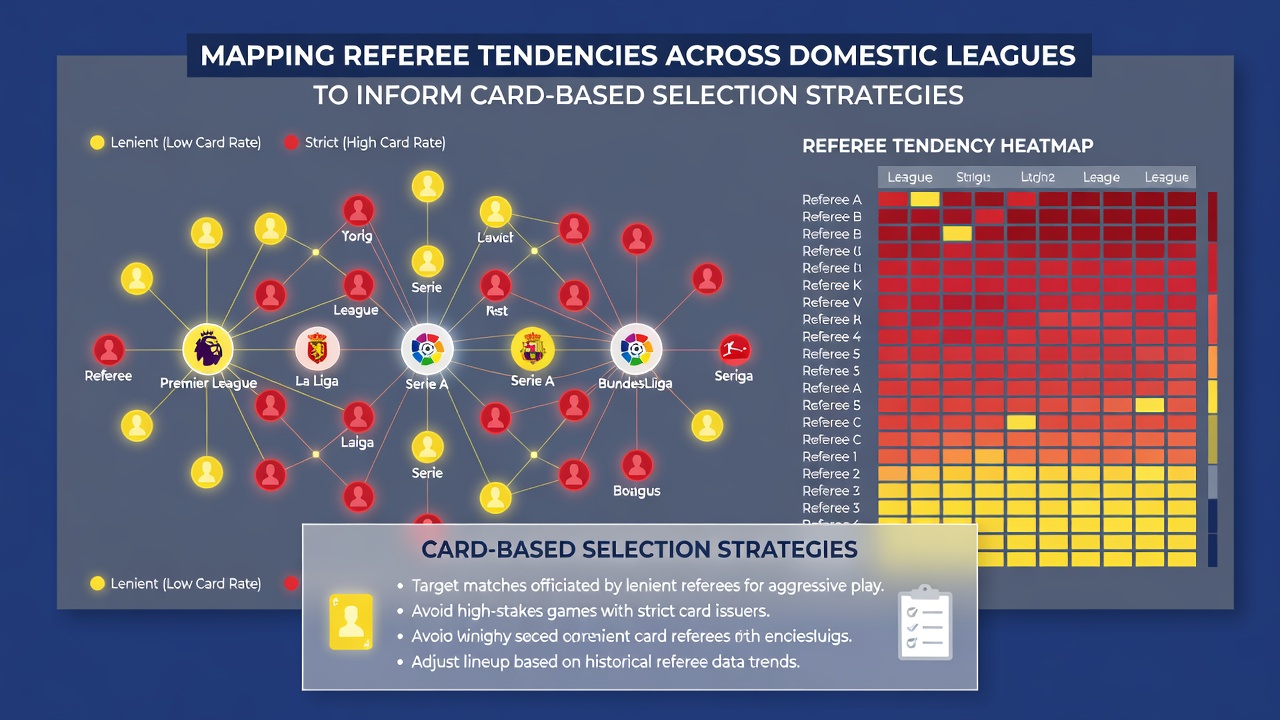
Analysts compile referee profiles by merging match logs, video review summaries, and official league statistics, and they update these profiles monthly to reflect any shifts in form or assignment patterns. A UEFA technical review released in early 2026 examined how referee experience levels correlate with card volume in high-pressure situations, and the findings indicate that officials with over 200 top-flight matches issue fewer late-game cards than those with fewer than 100 appearances. Similar work conducted by the University of Sydney sports analytics group focused on A-League and J-League cross-comparisons, confirming that environmental factors such as pitch size and altitude influence foul recognition rates.
These aggregated profiles feed directly into card-based selection processes by highlighting referees whose histories align with specific match conditions. Teams and analysts review upcoming fixtures against referee schedules released weeks in advance, then cross-check historical tendencies for both the appointed official and the fourth official who may step in. The process repeats across multiple leagues simultaneously, creating layered datasets that account for international breaks and domestic cup overlaps.
Seasonal Updates and Ongoing Adjustments
As the 2026/2027 campaign prepares to begin in August 2026, league authorities continue releasing updated referee performance reports that incorporate the previous season's closing fixtures. These releases allow profiles to incorporate any changes in style that emerged during congested April and May schedules, and analysts adjust weighting factors accordingly. The result is a continuously evolving map that reflects both long-term trends and short-term variations without relying on single-match outliers.
Conclusion
Comprehensive mapping of referee tendencies across domestic leagues supplies structured data that informs card-focused selection strategies throughout the football calendar. Multiple sources, ranging from league databases to independent academic reviews, confirm that individual officials maintain measurable patterns that persist across seasons and competitions. Analysts integrate these records with fixture details and contextual variables to refine approaches ahead of each match week, and the practice continues to expand as more leagues adopt standardized tracking systems.