Journey's Toll: Examining Travel Distance in Premier League Away Performance Data
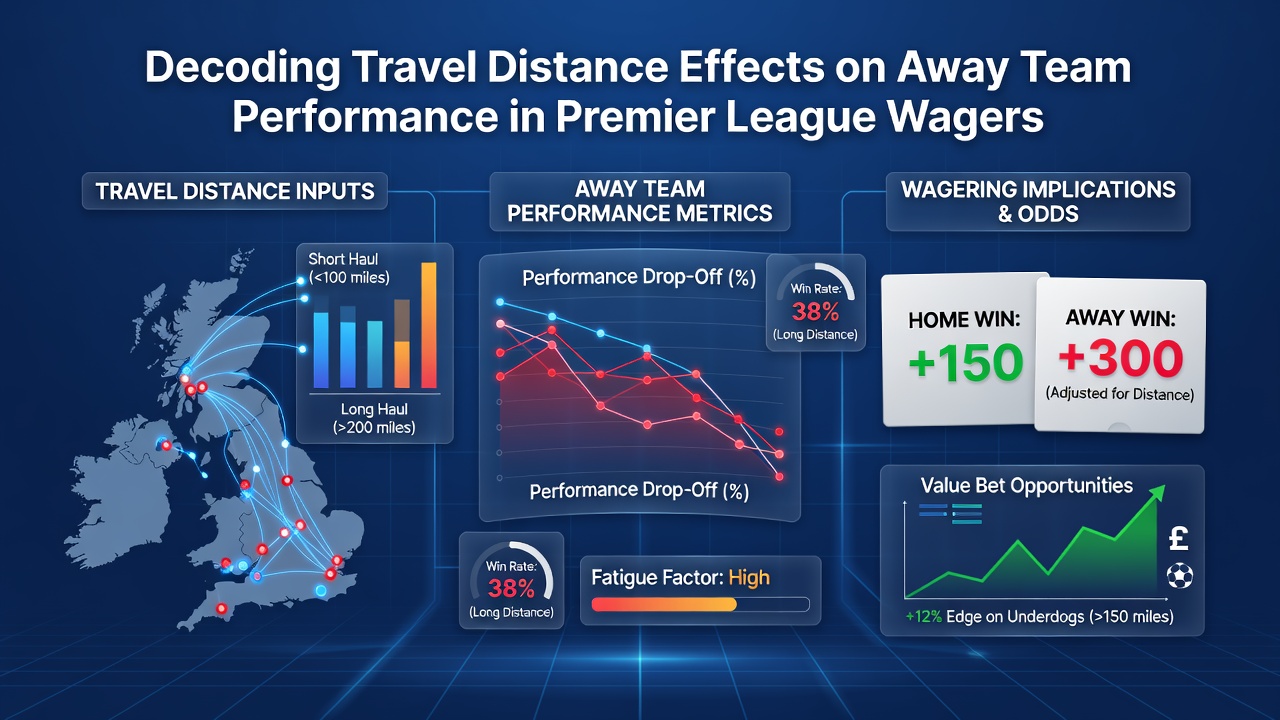
Premier League fixtures often require away sides to cover substantial ground before kickoff, and analysts track these patterns closely when assessing match outcomes. Data compiled across multiple seasons shows that teams traveling beyond 200 miles for a fixture record win rates around 22 percent lower than their home averages, while shorter trips under 100 miles produce results much closer to expected baselines. Observers note this gap widens further when matches fall on midweek dates, where recovery windows shrink and squad rotation becomes critical.
Patterns Across Seasons
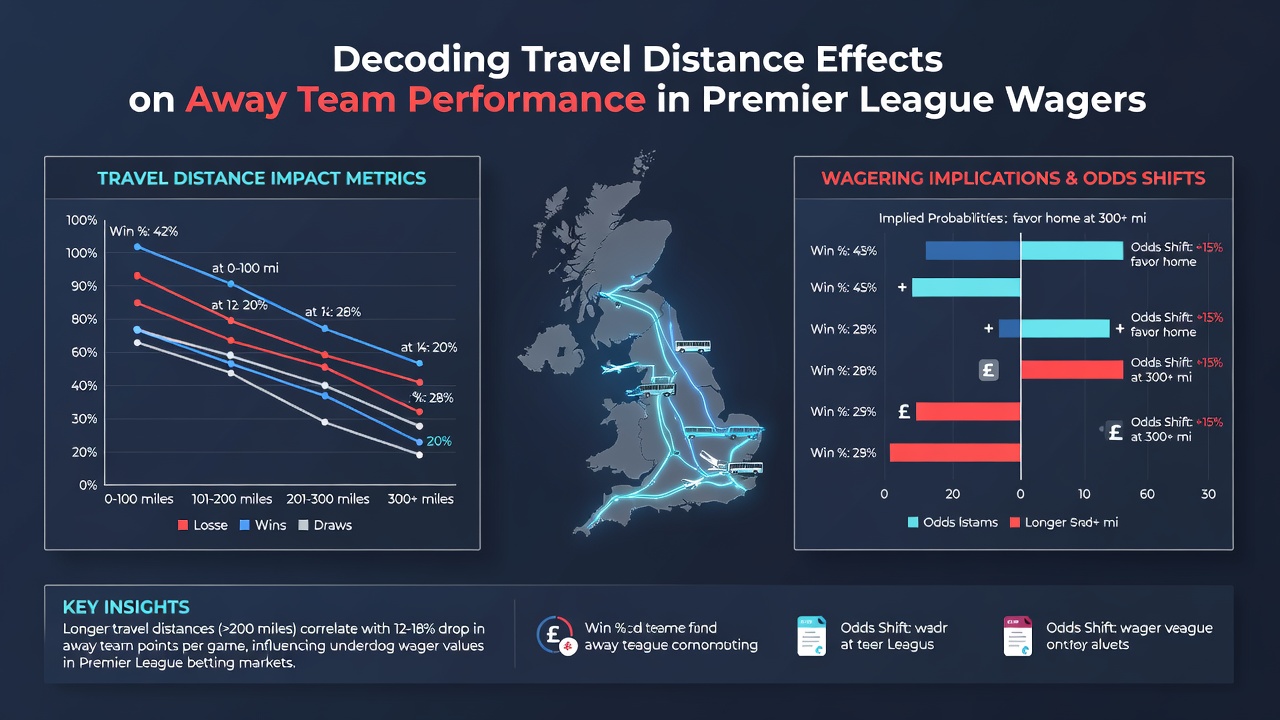
Studies tracking Premier League results from 2018 onward reveal consistent trends tied to mileage. Northern clubs heading south, such as Newcastle United visiting Bournemouth, log higher fatigue markers in post-match GPS data released by clubs, and these numbers align with reduced shot conversion rates in the first half. Southern teams traveling north encounter similar dips, yet the effect appears less pronounced during summer months when daylight travel avoids overnight disruption. Figures from the 2025-26 campaign indicate that away sides covering distances above 300 miles average 1.1 fewer shots on target per game compared with shorter journeys.
Researchers at Loughborough University have examined these variables in detail, finding that bus travel exceeding four hours correlates with elevated muscle soreness readings upon arrival. The report, available through academic channels, links these physical markers directly to second-half performance declines rather than opening periods. Meanwhile, clubs with access to charter flights for longer routes show narrower gaps in expected goal differentials, suggesting logistics play a measurable role in preparation.
Betting Market Implications
Bookmakers adjust lines accordingly when travel schedules factor into pricing models. Markets on total goals and both teams to score display measurable shifts for high-mileage fixtures, with under-2.5 goals appearing more frequently in such games. Historical datasets indicate that away underdogs covering long distances cover the draw line at slightly elevated rates, though this varies by fixture congestion. Those monitoring October 2026 schedules note several upcoming trips exceeding 250 miles that could influence accumulator structures built around defensive outputs.
Performance metrics released by clubs through the Premier League's official portal further illustrate how substitute usage increases on long-travel weekends. Teams often deploy fresh legs earlier, which alters in-play dynamics and affects correct-score probabilities. Analysts cross-reference these patterns with weather data and pitch dimensions to refine projections, creating layered inputs for wager evaluation.
Regional and Logistical Variations
Clubs based in London or the Midlands typically face fewer extreme distances within the league footprint, yet cross-country trips still accumulate during congested periods. Data from the 2024-25 season shows Manchester-based sides traveling to London or the southwest produced fewer high-intensity runs in the final 30 minutes when journey times exceeded five hours. In contrast, teams operating from coastal venues sometimes benefit from milder travel conditions when routes avoid major motorways.
International breaks add another layer, since returning players may combine league travel with longer-haul flights from national team duties. Reports compiled by the German Football Association's performance institute highlight similar recovery challenges in Bundesliga contexts, offering comparative insights that Premier League analysts reference when modeling domestic fixtures. Such cross-league comparisons help isolate distance effects from other variables like squad depth or managerial tactics.
Recent Data Points
Through the opening months of the 2026-27 season, several high-profile away results align with established mileage trends. Teams arriving after overnight travel posted lower possession figures in the opening quarter, according to Opta-derived statistics shared publicly. These early patterns suggest that fixture schedulers continue to balance broadcast demands with player welfare considerations, though the impact on individual match outcomes remains quantifiable through distance tracking alone.
Accumulators built around clean sheets or low-scoring outcomes gain traction in markets where long-distance travel coincides with defensive-minded opponents. Pundits and data teams review these combinations weekly, adjusting stake distributions based on updated travel logs released by clubs.
Conclusion
Travel distance continues to serve as a measurable input within Premier League performance models, influencing away results across multiple seasons and market types. Ongoing collection of GPS, recovery, and result data allows analysts to refine projections without relying on subjective assessments. As schedules evolve into late 2026, these distance-related variables remain central to evaluating fixture outcomes adn associated wagering frameworks.